IDT Corporation to Participate in Southwest IDEAS Investor Conference
NEWARK, NJ, Nov. 15, 2024 — IDT Corporation (NYSE: IDT), a global provider of fintech, cloud communications, and traditional communications, announced today that its Chief Financial Officer, Marcelo Fischer, will participate in the 16th Annual Southwest IDEAS Investor Conference on Wednesday, November 20th at The Statler in Dallas, TX.
Mr. Fischer’s presentation will take place from 11:30 to 12:05 Central Time. The presentation will be webcast and can be accessed through the conference host’s main website, https://www.threepartadvisors.com/southwest. The webcast and the investor presentation slides will also be available through the IDT investor relations website, https://www.idt.net/investors-and–media/.
In addition, Mr. Fischer will host meetings with conference participants throughout the day on Wednesday. To request a meeting or participate in the IDEAS conferences, please contact Lacey Wesley at (817) 769 -2373 or LWesley@IDEASconferences.com.
IDEAS Conferences provide independent, regional venues for companies to present to investment professionals. Additional information about the IDEAS conferences is available at www.IDEASConferences.com.
ABOUT IDT CORPORATION
IDT Corporation (NYSE: IDT) is a global provider of fintech and communications solutions through a portfolio of synergistic businesses: National Retail Solutions (NRS), through its point-of-sale (POS) platform, enables independent retailers to operate more effectively while providing advertisers and marketers with unprecedented reach into underserved consumer markets; BOSS Money facilitates innovative international remittances and fintech payments solutions; net2phone provides enterprises and organizations with intelligently integrated cloud communications and contact center services across channels and devices; IDT Digital Payments and the BOSS Revolution calling service make sharing prepaid products and services and speaking with friends and family around the world convenient and reliable; and, IDT Global and IDT Express enable communications services to provision and manage international voice and SMS messaging.
All statements above that are not purely about historical facts, including, but not limited to, those in which we use the words “believe,” “anticipate,” “expect,” “plan,” “intend,” “estimate,” “target” and similar expressions, are forward-looking statements within the meaning of the Private Securities Litigation Reform Act of 1995. While these forward-looking statements represent our current judgment of what may happen in the future, actual results may differ materially from the results expressed or implied by these statements due to numerous important factors. Our filings with the SEC provide detailed information on such statements and risks and should be consulted along with this release. To the extent permitted under applicable law, IDT assumes no obligation to update any forward-looking statements.
NRSInsights’ October 2024 Retail Same-Store Sales Report
October same-store sales increased 3.7% year-over-year
NEWARK, N.J., Nov. 08, 2024 — NRSInsights, a provider of sales data and analytics drawn from retail transactions processed through the National Retail Solutions (NRS) point-of-sale (POS) platform, today announced comparative same-store sales results for October 2024.
As of October 31, 2024, the NRS retail network comprised approximately 33,100 active terminals nationwide, scanning purchases at approximately 28,900 independent retailers including convenience stores, bodegas, liquor stores, grocers, tobacco, and sundries sellers nationwide, predominantly serving urban consumers.
October Retail Same-Store Sales Highlights
(Same-store sales, unit sales, transactions, and average price data throughout this release refer to October 2024 and are compared to October 2023 unless otherwise noted. All comparisons are provided on a “per calendar day” basis to remove from consideration variability in the number of days per month.)
SALES
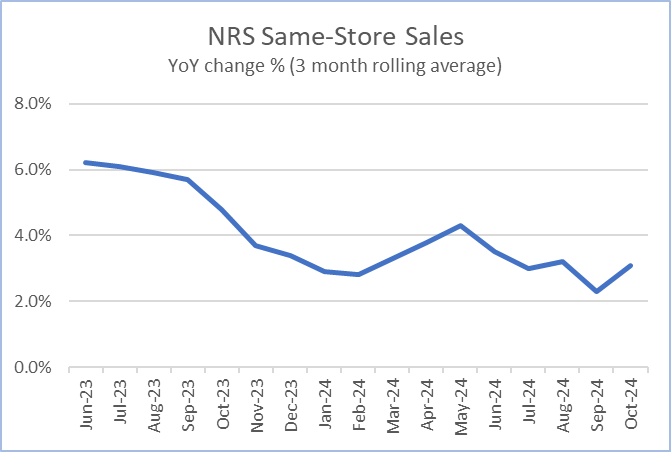
Same-store sales increased 3.7% year-over-year. In the previous month (September 2024), same-store sales had increased 2.2% year-over-year.
Same-store sales decreased (0.5)% compared to the previous month (September 2024). Same-store sales in September 2024 had decreased (1.3)% compared to the previous month (August 2024).
For the three months ended October 31, 2024, same-store sales increased 3.1% compared to the corresponding three months a year ago.
UNITS SOLD
The number of units sold increased 2.8% year-over-year. In the previous month (September 2024), the number of items sold had increased 2.9% year-over-year.
Units sold decreased (0.5)% compared to the previous month (September 2024). Units sold in September 2024 had increased 0.2% compared to the previous month (August 2024).
TRANSACTIONS PER STORE
The average number of transactions per store increased 1.6% year-over-year. In the previous month (September 2024), transactions had increased 0.8% year-over-year.
Transactions decreased (0.7)% compared to the previous month (September 2024). Transactions in September 2024 had also decreased (0.7)% compared to the previous month (August 2024).
AVERAGE PRICES
A dollar-weighted average of prices for the top 500 items purchased increased 1.9% year-over-year, a decrease from the 2.1% year-over-year increase recorded in September 2024.
Retail Trade Comparative Data
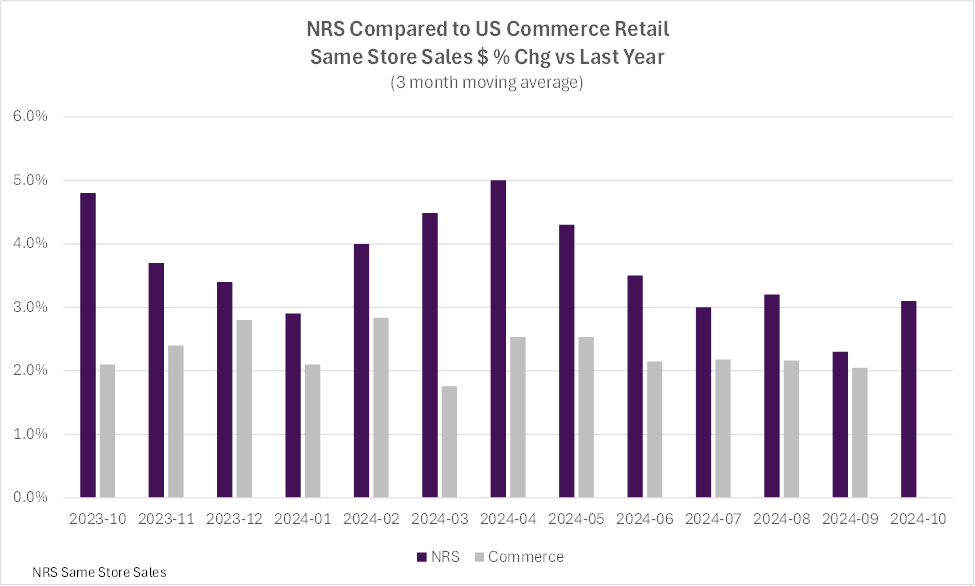
The table below provides historical comparative data with the U.S. Commerce Department’s Advance Monthly Retail Trade same-store sales data excluding food service:
Over the past twelve months, the NRS network’s three-month moving average same-store sales have outpaced the US Commerce Department’s Advance Monthly Retail Trade data, excluding food services, by 1.7% percentage points, on average.
The NRSInsights data in the chart above have not been adjusted to reflect inflation, demographic distributions, seasonal buying patterns, item substitution, days per month, or other factors that may facilitate comparisons to other periods, to other same-store retail sales data, or to the U.S. Commerce Department’s retail data.
Commentary from Suzy Silliman (SVP, Data Strategy and Sales at NRS)
“The NRS network had a strong October 2024 generating year-over-year same store sales growth of 3.7%, with all but three states (ID, ND, and CO) increasing sales. Sequentially, sales declined a slight 0.5% consistent with seasonal trends. Hurricane Milton, which might have been expected to negatively impact sales, did not. Sales in both North and South Carolina increased significantly year over year and sequentially.
“Beverage sales, both alcoholic and non-alcoholic, were exceptionally robust. October, due to Halloween parties and other seasonal celebrations, is typically a strong month for beverages, and the year-over-year growth was exceptional this October. Energy Beverages, which had suffered six consecutive months of year-over-year sales declines through September, broke trend to achieve modest year-over-year dollar sales gains.
“Sales of Candy, specifically Chocolate and Confections, continued to decrease across baskets, dollars, and units through the Halloween season versus the year ago. This is the second consecutive October we have reported year-over-year declines in unit sales for these categories.”
NRSInsights Reports
The NRSInsights monthly Same-Store Retail Sales Reports are intended to provide timely topline data reflective of sales at NRS’ network of independent, predominantly urban, retail stores.
Same-store data comparisons of October 2024 with October 2023 are derived from approximately 198 million transactions processed through the approximately 19,700 stores on the NRS network that scanned transactions in both months. Same-store data comparisons of October 2024 with September 2024 are derived from approximately 252 million transactions processed through approximately 27,700 stores.
Same-store data comparisons for the three months ended October 31, 2024 with the year-ago three months are derived from approximately 567 million scanned transactions processed through those stores that were in the NRS network in both quarters.
NRS POS Platform
The NRS platform predominantly serves small-format, independent, retail stores nationwide including convenience stores, bodegas, liquor stores, grocers, tobacco, and sundries sellers. These independent retailers operate in all 50 states as well as the District of Columbia, and in 201 of the 210 designated market areas (DMAs) in the United States. NRS’ POS terminals processed $20.3 billion in sales through approximately 1.4 billion transactions during the twelve months ended October 31, 2024. In October 2024, NRS store terminals processed $1.8 billion in sales (+20% year-over-year) across 131 million transactions (+17% year-over-year).
About National Retail Solutions (NRS):
National Retail Solutions operates the largest point-of-sale (POS) terminal-based platform and digital payment processing service for independent retailers nationwide. Retailers utilize NRS offerings to process transactions and effectively manage their businesses. Consumer packaged goods (CPG) suppliers, brokers, analytics firms, and advertisers access the terminal’s digital display network to reach these retailers’ predominantly urban, multi-cultural shopper base, and to harness transaction data-based learnings to identify growth opportunities and measure execution and returns on marketing investment. NRS is a subsidiary of IDT Corporation (NYSE: IDT).
All statements above that are not purely about historical facts, including, but not limited to, those in which we use the words “believe,” “anticipate,” “expect,” “plan,” “intend,” “estimate,” “target” and similar expressions, are forward-looking statements within the meaning of the Private Securities Litigation Reform Act of 1995. While these forward-looking statements represent our current judgment of what may happen in the future, actual results may differ materially from the results expressed or implied by these statements due to numerous important factors. Our filings with the SEC provide detailed information on such statements and risks, and should be consulted along with this release. To the extent permitted under applicable law, IDT assumes no obligation to update any forward-looking statements.
NRSInsights Contact: Suzy Silliman SVP, Data Strategy and Sales at NRS National Retail Solutions suzy.silliman@nrsplus.com
NRSInsights’ September 2024 Retail Same-Store Sales Report
September same-store sales increased 2.2% year-over-year
NEWARK, N.J., Oct. 09, 2024 — NRSInsights, a provider of sales data and analytics drawn from retail transactions processed through the National Retail Solutions (NRS) point-of-sale (POS) platform, today announced comparative same-store sales results for September 2024.
As of September 30, 2024, the NRS retail network comprised approximately 32,700 active terminals nationwide, scanning purchases at approximately 28,400 independent retailers including bodegas, convenience stores, liquor stores, grocers, tobacco, and sundries sellers nationwide, predominantly serving urban consumers.
September Retail Same-Store Sales Highlights
(Same-store sales, unit sales, transactions, and average price data throughout this release refer to September 2024 and are compared to September 2023 unless otherwise noted. All comparisons are provided on a “per calendar day” basis to remove from consideration variability in the number of days per month.)
SALES
Same-store sales increased 2.2% year-over-year. In the previous month (August 2024), same-store sales had increased 5.1% year-over-year.
Same-store sales decreased (1.3)% compared to the previous month (August 2024). Same-store sales in August 2024 had increased 1.7% compared to the previous month (July 2024).
For the three months ended September 30, 2024, same-store sales increased 2.3% compared to the corresponding three months a year ago.
UNITS SOLD
The number of units sold increased 2.9% year-over-year. In the previous month (August 2024), the number of items sold had increased 4.7% year-over-year.
Units sold increased 0.2% compared to the previous month (August 2024). Units sold in August 2024 had increased 1.3% compared to the previous month (July 2024).
TRANSACTIONS PER STORE
The average number of transactions per store increased 0.8% year-over-year. In the previous month (August 2024), transactions had increased 1.8% year-over-year.
Transactions decreased (0.7)% compared to the previous month (August 2024). Transactions in August 2024 had increased 1.5% compared to the previous month (July 2024).
AVERAGE PRICES
A dollar-weighted average of prices for the top 500 items purchased during September 2024 increased 2.1% year-over-year, a decrease from the 3.5% year-over-year increase recorded in August 2024.
Retail Trade Comparative Data
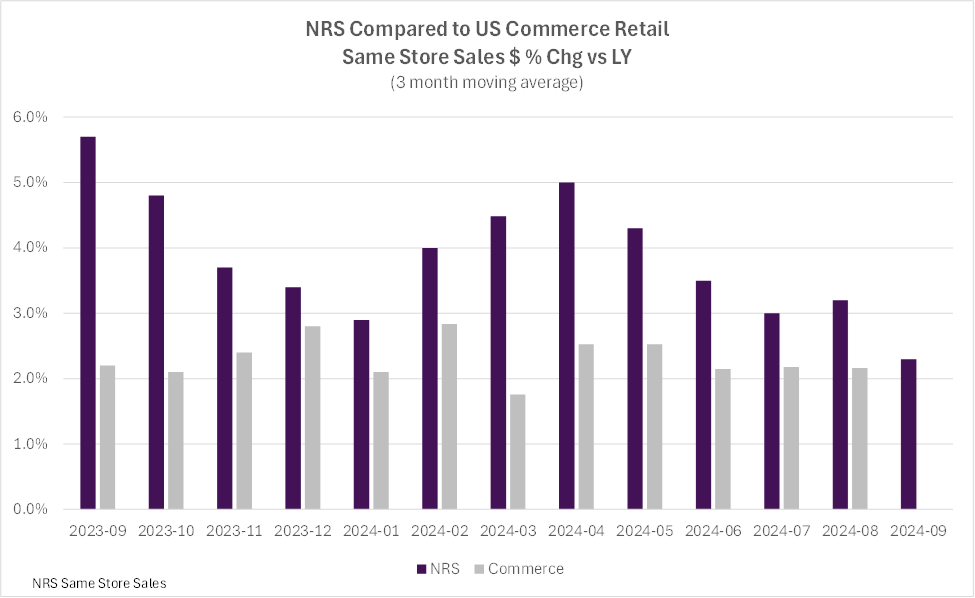
The table below provides historical comparative data with the U.S. Commerce Department’s Advance Monthly Retail Trade same-store sales data excluding food service:
Over the past twelve months, the NRS network’s three-month moving average same-store sales have outpaced the US Commerce Department’s Advance Monthly Retail Trade data, excluding food services, by 1.7% percentage points, on average.
The NRSInsights data in the chart above have not been adjusted to reflect inflation, demographic distributions, seasonal buying patterns, item substitution, days per month, or other factors that may facilitate comparisons to other periods, to other same-store retail sales data, or to the U.S. Commerce Department’s retail data.
Commentary from Suzy Silliman (SVP, Data Strategy and Sales at NRS)
“NRS’ year over year rate of same-store sales growth increased a modest 2.2% in September while decreasing 1.3% compared to August.
“During the past several months, we noted several categories that had been experiencing year-over-year sales declines. In September, Chocolate and Confection, Vape, Energy Drinks, Sports Drinks, and Sweet Snacks all decreased once again compared to the year ago. Chocolate and Confection’s rate of decrease accelerated compared to the prior months’ rate while the other categories’ rates of decline remained stable.
“On the flip side, categories sustaining robust year-over-year growth trends included Smokeless Tobacco, Tequila, Prepared Cocktails, and Wine Based Cocktails. Other categories with strong increases in September compared to the year ago included Laundry Detergent & Fabric Softeners, Supplements, Pork Rinds, Sparkling Water, and Rolling Papers.
“Several categories within the “School Lunch” classification also showed year over year growth in September including Lunchmeats & Cheeses, Yogurts, Nut Butters & Jellies/Jams, Snack & Variety Packs, and Food & Beverage Containers.
“Geographically, we saw sales declines in Florida and Georgia during the last week of September as evacuations and shutdowns from Hurricane Helene began. There were no noticeable impacts to sales in the Carolinas or Tennessee by month’s end. Nationwide, stores in New York, New Jersey and Pennsylvania enjoyed the most significant year-over-year gains across dollars, quantities, and baskets.”
NRSInsights Reports
The NRSInsights monthly Same-Store Retail Sales Reports are intended to provide timely topline data reflective of sales at NRS’ network of independent, predominantly urban, retail stores.
Same-store data comparisons of September 2024 with September 2023 are derived from approximately 191 million transactions processed through the approximately 19,400 stores on the NRS network that scanned transactions in both months. Same-store data comparisons of September 2024 with August 2024 are derived from approximately 251 million transactions processed through approximately 27,400 stores.
Same-store data comparisons for the three months ended September 30, 2024 with the year-ago three months are derived from approximately 562 million scanned transactions processed through those stores that were in the NRS network in both quarters.
NRS POS Platform
The NRS platform predominantly serves small-format, independent, retail stores nationwide including convenience stores, bodegas, liquor stores, grocers, tobacco, and sundries sellers. These independent retailers operate in all 50 states as well as the District of Columbia, and in 201 of the 210 designated market areas (DMAs) in the United States. NRS’ POS terminals processed $20.0 billion in sales through approximately 1.4 billion transactions during the twelve months ended September 30, 2024.
About National Retail Solutions (NRS):
National Retail Solutions operates the largest point-of-sale (POS) terminal-based platform and digital payment processing service for independent retailers nationwide. Retailers utilize NRS offerings to process transactions and effectively manage their businesses. Consumer packaged goods (CPG) suppliers, brokers, analytics firms, and advertisers access the terminal’s digital display network to reach these retailers’ predominantly urban, multi-cultural shopper base, and to harness transaction data-based learnings to identify growth opportunities and measure execution and returns on marketing investment. NRS is a subsidiary of IDT Corporation (NYSE: IDT).
All statements above that are not purely about historical facts, including, but not limited to, those in which we use the words “believe,” “anticipate,” “expect,” “plan,” “intend,” “estimate,” “target” and similar expressions, are forward-looking statements within the meaning of the Private Securities Litigation Reform Act of 1995. While these forward-looking statements represent our current judgment of what may happen in the future, actual results may differ materially from the results expressed or implied by these statements due to numerous important factors. Our filings with the SEC provide detailed information on such statements and risks, and should be consulted along with this release. To the extent permitted under applicable law, IDT assumes no obligation to update any forward-looking statements.
NRSInsights Contact: Suzy Silliman SVP, Data Strategy and Sales at NRS National Retail Solutions suzy.silliman@nrsplus.com
4Q24 income from operations +68% YoY to $20.1 million; Adjusted EBITDA** +40% to a record $25.2 million
4Q24 GAAP EPS increased YoY to $1.45 from $0.31; Non-GAAP EPS increased to $0.57 from $0.36
NEWARK, NJ, Oct. 08, 2024 — IDT Corporation (NYSE: IDT), a global provider of fintech, cloud communications, and traditional communications solutions, today reported results for the fourth quarter and full fiscal year 2024, the three and twelve months ended July 31, 2024.
FOURTH QUARTER HIGHLIGHTS
(Throughout this release, unless otherwise noted, results for the fourth quarter of fiscal year 2024 (4Q24) are compared to the fourth quarter of fiscal year 2023 (4Q23) and results for FY 2024 are compared to FY 2023. All earnings per share (EPS) and other ‘per share’ results are per diluted share.)
Business Highlights:
NRS added 1,800 net new active point-of-sale (POS) terminals, aided by summer seasonal factors, to reach approximately 32,100 at July 31st. Recurring revenue increased 42% to $26.7 million led by a 57% increase in merchant services revenue. Income from operations jumped 252% to $6.0 million, and Adjusted EBITDA increased 195% to $7.1 million;
BOSS Money increased remittance transactions by 42% to 5.4 million and revenue by 41% to $31.5 million;
net2phone added approximately 12,000 net seats served, to reach approximately 396,000 seats at July 31st. Subscription revenue increased 15% to $20.5 million;
IDT Consolidated:
Revenue increased 2% to $308.8 million driven by revenue growth at NRS, BOSS Money, net2phone and IDT Digital Payments.
Gross profit increased 13% to $102.2 million and gross profit margin increased 320 bps to 33.1% – both record levels, driven by the rapid expansion of IDT’s high-margin businesses;
Income from operations increased 68% to $20.1 million;
Net income attributable to IDT increased 362% to $36.8 million from $8.0 million, including the positive impact of an income tax benefit in 4Q24 of $23.6 million;
GAAP EPS increased to $1.45 from $0.31;
Non-GAAP EPS** increased to $0.57 from $0.36;
Consolidated Adjusted EBITDA increased 40% to $25.2 million, the highest level of quarterly Adjusted EBITDA in IDT’s history;
Repurchased 94,314 shares of IDT Class B common stock in market transactions for $3.4 million.
FISCAL YEAR 2024 HIGHLIGHTS
Business Highlights:
NRS added approximately 6,400 net new active terminals and increased recurring revenue 36% to $96.9 million. Income from operations increased 50% to $21.6 million and Adjusted EBITDA increased 49% to $25.0 million;
BOSS Money increased transaction volume 41% to 18.34 million and increased revenue 41% to $108.3 million;
net2phone increased subscription revenue 17% to $78.4 million;
IDT Consolidated:
Revenue decreased 3% to $1,205.8 million due to declines in IDT’s Traditional Communications segment revenues that were in line with expectations;
Gross profit increased 9% to $390.2 million and gross profit margin increased 360 bps to 32.4%, both all-time, full fiscal year record levels;
Income from operations increased 7% to $64.8 million;
Net income attributable to IDT increased 59% to $64.5 million, including the positive impact of an income tax benefit of $23.6 million;
GAAP EPS increased to $2.54 from $1.58;
Non-GAAP EPS increased to $1.95 from $1.86;
Adjusted EBITDA increased 4% to $89.7 million, the highest level in IDT’s history;
Repurchased 298,421 shares of IDT Class B common stock in market transactions for $9.1 million.
REMARKS BY SHMUEL JONAS, CEO
“IDT delivered a strong fourth quarter highlighted by record Adjusted EBITDA to cap off our 2024 fiscal year. NRS, BOSS Money and net2phone all performed well, while our Traditional Communications segment businesses delivered solid cash flows.
“At NRS, we continued to make good progress on our strategic priorities – expanding our customer base in the large independent retailer market, increasing the penetration of NRS Pay, developing point of sale solutions for new verticals, building out our advertising tech and deploying hundreds of screens in new locations outside of our independent retail market – all while significantly increasing profitability.
“At BOSS Money, we again achieved year-over-year transaction volume and revenue growth of over 40% during the fourth quarter. BOSS Money’s economics continue to improve as the business scales, which enabled our Fintech segment to achieve its first quarter of positive cash-flow generation.
“net2phone is steadily building its customer base – again adding approximately twelve thousand net new seats including two thousand CCaaS seats in the fourth quarter- while also doing a good job of controlling costs. As a result, net2phone’s Adjusted EBTIDA margin more than doubled compared to the year ago quarter. We are focused on further improving net2phone’s bottom line through continued volume growth and increasing revenue per user – driven by expansion of our higher-revenue, higher-margin CCaaS offering and by migrating customers to premium plans and features, including plans with new AI-powered functionalities.
“In our Traditional Communications segment, we significantly improved the economics of our business, and began to see the expected payoff from cost reduction initiatives we implemented throughout fiscal year 2024. In fiscal 2025, we will continue to pursue opportunities to improve the performance of our business and lower costs while maximizing cash-flows and reinvesting in customer acquisition.
“IDT enters fiscal 2025 with strong momentum. NRS, BOSS Money and ne2phone are all profitable and each has a long growth runway. In the year ahead, we will drive their continued expansion and invest in new, exciting growth initiatives that leverage our strategic assets and expertise.
“We remain committed to maximizing the cash generation from each of our segments, building dynamic businesses for long term value creation, and returning value to our stockholders through our investments in new initiatives, share buybacks and dividends.”
CONSOLIDATED RESULTS
IDT Consolidated Results ($ in millions, except gross profit margin and EPS)
4Q24
4Q23
4Q24-4Q23 (% Δ)
FY24
FY23
FY24-FY23 (% Δ)
Revenue
$
308.8
$
303.88
+1.7
%
$
1,205.8
$
1,238.9
(2.7
)%
Gross profit
$
102.2
$
90.7
+12.7
%
$
390.2
$
357.2
+9.2
%
Gross profit margin
33.1
%
29.9
%
+320 bps
32.4
%
28.8
%
+360 bps
Technology & development
$
12.6
$
12.1
+3.8
%
$
50.6
$
48.0
+5.3
%
SG&A
$
69.5
$
65.7
+5.8
%
$
270.2
$
243.2
+11.1
%
Income from operations
$
20.1
$
12.0
+68.4
%
$
64.8
$
60.7
+6.6
%
Net income attributable to IDT
$
42.0
$
8.0
+426.3
%
$
69.6
$
40.5
+71.9
%
Adjusted EBITDA
$
25.2
$
18.1
+39.5
%
$
89.7
$
86.2
+4.1
%
GAAP EPS (diluted)
$
1.45
$
0.31
+$
1.14
$
2.54
$
1.58
+$
0.96
Non-GAAP EPS (diluted)
$
0.57
$
0.36
+$
0.21
$
1.95
$
1.86
+$
0.09
FOURTH QUARTER & FISCAL YEAR 2024 RESULTS BY SEGMENT
Fiscal Quarters (in millions)
NRS
Fintech
net2phone
Traditional Communications
4Q24
4Q23
(%Δ)
4Q24
4Q23
(%Δ)
4Q24
4Q23
(%Δ)
4Q24
4Q23
(%Δ)
Revenue
$
28.2
$
19.9
+42
%
$
34.6
$
24.6
+41
%
$
21.4
$
19.3
+11
%
$
224.6
$
240.0
(6
)%
Direct cost of revenue
$
2.1
$
2.7
(22
)%
$
15.5
$
11.0
+41
%
$
4.5
$
4.0
+12
%
$
184.5
$
195.4
(6
)%
Gross profit
$
26.1
$
17.2
+52
%
$
19.1
$
13.6
+40
%
$
16.8
$
15.2
+11
%
$
40.1
$
44.7
(10
)%
Gross profit margin
92.6
%
86.6
%
+600 bps
55.2
%
55.3
%
(10) bps
78.8
%
79.0
%
(20) bps
17.9
%
18.6
%
(70) bps
Technology & development
$
1.8
$
1.5
+19
%
$
2.4
$
2.0
+23
%
$
2.8
$
2.5
+11
%
$
5.5
$
6.1
(10
)%
SG&A expense
$
18.2
$
14.0
+29
%
$
15.9
$
13.6
+17
%
$
13.1
$
13.2
(1
)%
$
20.2
$
22.3
(10
)%
Income (loss) from operations
$
6.0
$
1.7
+252
%
$
2.5
$
(1.9
)
na
$
0.8
$
(0.7
)
na
$
13.9
$
14.1
(1
)%
Adjusted EBITDA
$
7.1
$
2.4
+195
%
$
1.5
$
(1.2
)
na
$
2.5
$
0.9
+170
%
$
16.3
$
18.6
(12
)%
Fiscal Years (in millions)
NRS
Fintech
net2phone
Traditional Communications
FY24
FY23
(%Δ)
FY24
FY23
(%Δ)
FY24
FY23
(%Δ)
FY24
FY23
(%Δ)
Revenue
$
103.1
$
77.1
+34
%
$
120.7
$
86.6
+39
%
$
82.3
$
72.4
+14
%
$
899.6
$
1,002.7
$(10
)%
Direct cost of revenue
$
11.6
$
10.7
+8
%
$
53.4
$
36.6
+46
%
$
17.2
$
15.3
+13
%
$
733.4
$
819.0
(11
)%
Gross profit
$
91.5
$
66.4
+38
%
$
67.3
$
50.0
+35
%
$
65.1
$
57.1
+14
%
$
166.2
$
183.7
(10
)%
Gross profit margin
88.7
%
86.1
%
+260 bps
55.8
%
57.7
%
(190) pbs
79.1
%
78.9
%
+20 bps
18.5
%
18.3
%
+20 bps
Technology & development
$
7.1
$
5.0
+43
%
$
9.5
$
7.3
+31
%
$
10.8
$
10.0
+8
%
$
23.2
$
25.8
(10
)%
SG&A expense
$
62.7
$
47.0
+33
%
$
59.6
$
47.2
+26
%
$
52.6
$
49.7
+6
%
$
84.9
$
89.9
(6
)%
Income (loss) from operations
$
21.6
$
14.4
+50
%
$
(0.1
)
$
(2.5
)
na
$
1.7
$
(2.8
)
na
$
56.4
$
61.3
(8
)%
Adjusted EBITDA
$
25.0
$
16.8
+49
%
$
1.1
$
(1.8
)
na
$
7.9
$
3.0
+158
%
$
66.3
$
77.5
(14
)%
National Retail Solutions (NRS)
During 4Q24 and 4Q23, the NRS segment contributed 9.1% and 6.6% of IDT’s consolidated revenue, respectively. For FY 2024 and FY 2023, the corresponding contributions were 8.6% and 6.2%, respectively.
National Retail Solutions (NRS) (Terminals and accounts at end of period. $ in millions, except for revenue per terminal)
4Q24
3Q24
4Q23
4Q24-4Q23 (% Δ)
FY24
FY23
FY24-FY23 (% Δ)
Terminals and payment processing accounts
Active POS terminals
32,100
30,300
25,700
+25
%
Payment processing accounts
21,300
19,500
15,800
+35
%
Recurring revenue
Merchant Services & Other
$
16.2
$
14.4
$
10.3
+57
%
$
54.5
$
32.8
+66
%
Advertising and Data
$
7.4
$
6.7
$
6.2
+19
%
$
31.2
$
30.6
+2
%
SaaS Fees
$
3.1
$
2.9
$
2.3
+34
%
$
11.2
$
8.0
+39
%
Total recurring revenue
$
26.7
$
24.0
$
18.8
+42
%
$
96.9
$
71.4
+36
%
POS Terminal Sales
$
1.6
$
1.8
$
1.1
+41
%
$
6.3
$
5.7
+10
%
Total revenue
$
28.2
$
25.7
$
19.9
+42
%
$
103.1
$
77.1
+34
%
Monthly average recurring revenue per terminal*
$
285
$
271
$
253
+13
%
$
279
$
264
+6
%
Gross profit
$
26.1
$
22.1
$
17.2
+52
%
$
91.5
$
66.4
+38
%
Gross profit margin
93
%
86
%
87
%
+600 bps
89
%
86
%
+260 bps
Technology & development
$
1.8
$
1.7
$
1.5
+19
%
$
7.1
$
5.0
+43
%
SG&A
$
18.2
$
15.7
$
14.0
+29
%
$
62.7
$
47.0
+33
%
Income from operations
$
6.0
$
4.8
$
1.7
+252
%
$
21.6
$
14.4
+50
%
Adjusted EBITDA
$
7.1
$
5.6
$
2.4
+195
%
$
25.0
$
16.8
+49
%
NRS Take-Aways / Updates:
During 4Q24, NRS added approximately 1,800 net active terminals – inclusive of the addition of several hundred terminals at summer seasonal businesses. During FY 2024, NRS added approximately 6,400 net active terminals.
During 4Q24, NRS added approximately 1,900 net payment processing accounts, also inclusive of seasonal businesses. During FY 2024, NRS added approximately 5,600 net payment processing accounts.
The increase in Merchant Services & Other revenue (+57% in 4Q24, +66% in FY 2024) was driven by the increase in NRS Pay accounts and a robust increase in average revenue per NRS pay account.
Fintech
During 4Q24 and 4Q23, the Fintech segment contributed 11.2% and 8.1% of IDT’s consolidated revenue, respectively. For FY 2024 and FY 2023, the corresponding contributions were 10.0% and 7.0%, respectively.
Fintech (Transactions in millions. $ in millions except for revenue per transaction)
4Q24
3Q24
4Q23
4Q24-4Q23 (% Δ, $)
FY24
FY23
FY24-FY23 (% Δ, $)
BOSS Money Transactions
5.4
4.7
3.8
+42
%
18.3
13.0
+41
%
Fintech Revenue
BOSS Money
$
31.5
$
27.6
$
22.3
+41
%
$
108.3
$
76.9
+41
%
Other
$
3.2
$
3.9
$
2.3
+37
%
$
12.4
$
9.7
+28
%
Total Revenue
$
34.6
$
31.5
$
24.6
+41
%
$
120.7
$
86.6
+39
%
Average revenue per transaction*
$
5.84
$
5.84
$
5.87
(0.7
)%
$
5.91
$
5.93
(0.3
)%
Gross profit
$
19.1
$
17.3
$
13.6
+40
%
$
67.3
$
50.0
+35
%
Gross profit margin
55.2
%
54.9
%
55.3
%
(10)
bps
55.8
%
57.7
%
(190)
bps
Technology & development
$
2.4
$
2.5
$
2.0
+23
%
$
9.5
$
7.3
+31
%
SG&A
$
15.9
$
15.3
$
13.6
+17
%
$
59.6
$
47.2
+26
%
Income (loss) from operations
$
2.5
$
(0.6
)
$
(1.9
)
+$
4.5
$
(0.1
)
$
(2.5
)
+$
2.4
Adjusted EBITDA
$
1.5
$
0.2
$
(1.2
)
+$
2.7
$
1.1
$
(1.8
)
+$
2.8
Fintech Take-Aways:
The 42% increase in BOSS Money transactions in 4Q24 included both a 42% increase in digital transactions and a 41% increase in retail transactions, the latter being driven by the expansion of the BOSS Money retail agent network and enhancements to the retailer portal. In FY 2024, transactions increased 41% including a 46% increase in retail transactions and a 40% increase in digital transactions.
BOSS Money revenue increased 41% in both 4Q24 and in FY 2024 driven primarily by cross-marketing within the larger BOSS ecosystem and expansion of the retail agent network.
Fintech’s income from operations of $2.5 million in 4Q24 included a gain of $1.8 million from the write-off of a contingent consideration payment obligation related to an acquisition in a prior period. Fintech’s loss from operations in FY 2024 and FY 2023 included gains of $1.8 million and $1.6 million, respectively, from the write-off of contingent consideration payment obligations.
Fintech Adjusted EBITDA increased by $2.7 million and $2.8 million in 4Q24 and FY 2024, respectively, driven by BOSS Money revenue growth, combined with improved operating leverage as the business continues to scale.
net2phone
During 4Q24 and 4Q23, the net2phone segment contributed 6.9% and 6.3% of IDT’s consolidated revenue, respectively. For FY 2024 and FY 2023, the corresponding contributions were 6.8% and 5.8%, respectively.
net2phone (Seats in thousands at end of period. $ in millions)
4Q24
3Q24
4Q23
4Q24-4Q23 (% Δ, $)
FY24
FY23
FY24-FY23 (% Δ, $)
Seats
396
384
352
+13
%
Revenue
Subscription revenue
$
20.5
$
20.0
$
17.9
+15
%
$
78.4
$
66.8
+17
%
Other revenue
$
0.9
$
0.6
$
1.4
(38
)%
$
4.0
$
5.6
(29
)%
Total Revenue
$
21.4
$
20.7
$
19.3
+11
%
$
82.3
$
72.4
+14
%
Gross profit
$
16.8
$
16.4
$
15.2
+11
%
$
65.1
$
57.1
+14
%
Gross profit margin
78.8
%
79.2
%
79.0
%
(20)
bps
79.1
%
78.9
%
+20
bps
Technology & development
$
2.8
$
2.8
$
2.5
11
%
$
10.8
$
10.0
+8
%
SG&A
$
13.1
$
13.0
$
13.2
(1
)%
$
52.6
$
49.7
+6
%
Income (loss) from operations
$
0.8
$
0.5
$
(0.7
)
+$
1.6
$
1.7
$
(2.8
)
+$
4.4
Adjusted EBITDA
$
2.5
$
2.1
$
0.9
+$
1.5
$
7.9
$
3.0
+$
4.8
net2phone Take-Aways:
In 4Q24, net2phone increased seats served by 13% year over year powered by continued expansion in key markets led primarily by the U.S., Brazil, and Mexico.
In 4Q24, subscription revenue increased 15% year-over-year driven by the increase in seats served. Additionally, subscription revenue per seat* increased by 2%.
In FY 2024, subscription revenue increased 17% compared to FY 2023. Subscription revenue per seat increased by 4%.
In 4Q24, net2phone’s operating margin* increased to +4% from (4)% in 4Q23, and Adjusted EBITDA margin* increased to 11% from 5% in 4Q23. In FY 2024, net2phone’s operating margin increased to +2% from (4)% in FY 2023, and Adjusted EBITDA margin increased to 10% from 4% in FY 2023.
Traditional Communications
During 4Q24 and 4Q23, the Traditional Communications segment contributed 72.7% and 79.0% of IDT’s consolidated revenue, respectively. For FY 2024 and FY 2023, the corresponding contributions were 74.6% and 81.0%, respectively.
Traditional Communications ($ in millions)
4Q24
3Q24
4Q23
4Q24-4Q23 (% Δ)
FY24
FY23
FY24-FY23 (% Δ)
Revenue
IDT Digital Payments
$
106.1
$
101.6
$
100.8
+5
%
$
407.4
$
417.1
(2
)%
BOSS Revolution
$
62.2
$
63.2
$
75.4
(18
)%
$
263.2
$
322.1
(18
)%
IDT Global
$
50.3
$
50.1
$
55.6
(10
)%
$
201.1
$
230.3
(13
)%
Other
$
6.0
$
6.9
$
8.2
(27
)%
$
27.8
$
33.3
(16
)%
Total Revenue
$
224.6
$
221.7
$
240.0
(6
)%
$
899.6
$
1,002.7
(10
)%
Gross profit
$
40.1
$
41.2
$
44.7
(10
)%
$
166.2
$
183.7
(10
)%
Gross profit margin
17.9
%
18.6
%
18.6
%
(70)
bps
18.5
%
18.3
%
+20
bps
Technology & development
$
5.5
$
5.6
$
6.1
(10
)%
$
23.2
$
25.8
(10
)%
SG&A
$
20.2
$
22.7
$
22.3
(10
)%
$
84.9
$
89.9
(6
)%
Income from operations
$
13.9
$
12.5
$
14.1
(1
)%
$
56.4
$
61.3
(8
)%
Adjusted EBITDA
$
16.3
$
14.9
$
18.6
(12
)%
$
66.3
$
77.5
(14
)%
Take-Aways:
The year-over-year and sequential increases in IDT Digital Payments’ 4Q24 revenue largely reflect improved unit economics.
IDT Global substantially mitigated the bottom-line impacts of decreasing revenue through a traffic mix shift to higher margin routes;
The sequential increases in income from operations and Adjusted EBITDA were driven by both improved unit economics at IDT Digital Payments and decreases in SG&A and Technology & Development expenses following significant cost cutting and streamlining initiatives undertaken earlier in FY 2024.
OTHER FINANCIAL RESULTS
Consolidated results for all periods presented include corporate overhead. Corporate G&A expense was $2.2 million in 4Q24 compared to $2.6 million in 4Q23. In FY 2024, corporate G&A expense totaled $10.5 million compared to $9.3 million a year earlier.
As of July 31, 2024, IDT held $193.0 million in cash, cash equivalents, debt securities, and current equity investments. Current assets totaled $422.5 million and current liabilities totaled $279.3 million. IDT had no outstanding debt at the fiscal year end.
Net cash provided by operating activities in 4Q24 increased to $28.9 million from $25.4 million in 4Q23. Exclusive of changes in customer deposit balances at IDT’s Gibraltar-based bank, net cash provided by operating activities in 4Q24 increased to $31.9 million compared to $27.1 million in 4Q23.
In FY 2024, net cash provided by operating activities increased to $78.2 million from $54.1 million in FY 2023. Exclusive of changes in customer deposit balances at IDT’s Gibraltar-based bank, net cash provided by operating activities in FY 2024 increased to $81.6 million from $58.3 million in FY 2023.
Capital expenditures decreased to $5.3 million in 4Q24 from $5.9 million in 4Q23. Capital expenditures decreased to $18.9 million in FY 2024 from $22.0 million in FY 2023.
DIVIDEND
IDT paid a quarterly dividend of $0.05 on its Class A and Class B Common stock on October 7th to stockholders of record as of the close of business on September 30th.
IDT EARNINGS ANNOUNCEMENT INFORMATION
This release is available for download in the “Investors & Media” section of the IDT Corporation website (https://www.idt.net/investors-and-media) and has been filed on a current report (Form 8-K) with the SEC.
IDT will host an earnings conference call beginning at 5:30 PM Eastern with management’s discussion of results followed by Q&A with investors. To listen to the call and participate in the Q&A, dial 1-888-506-0062 (toll-free from the US) or 1-973-528-0011 (international) and provide the following access code: 126998).
A replay of the conference call will be available approximately three hours after the call concludes through October 22, 2024. To access the call replay, dial 1-877-481-4010 (toll-free from the US) or 1-919-882-2331 (international) and provide this replay passcode: 51021. The replay will also be accessible via streaming audio at the IDT investor relations website.
NOTES
*NRS revenue refers to recurring revenue. net2phone revenue refers to subscription revenue. See ‘Explanation of Key Performance Metrics’ at the end of this release.
**Adjusted EBITDA and Non-GAAP EPS are Non-GAAP financial measures intended to provide useful information that supplements IDT’s or the relevant segment’s results in accordance with GAAP. Please refer to the Reconciliation of Non-GAAP Financial Measures later in this release for an explanation of these terms and their respective reconciliations to the most directly comparable GAAP measures.
ABOUT IDT CORPORATION
IDT Corporation (NYSE: IDT) is a global provider of fintech and communications solutions through a portfolio of synergistic businesses: National Retail Solutions (NRS), through its point-of-sale (POS) platform, enables independent retailers to operate more effectively while providing advertisers and marketers with unprecedented reach into underserved consumer markets; BOSS Money facilitates innovative international remittances and fintech payments solutions; net2phone provides enterprises and organizations with intelligently integrated cloud communications and contact center services across channels and devices; IDT Digital Payments and the BOSS Revolution calling service make sharing prepaid products and services and speaking with friends and family around the world convenient and reliable; and, IDT Global and IDT Express enable communications services to provision and manage international voice and SMS messaging.
All statements above that are not purely about historical facts, including, but not limited to, those in which we use the words “believe,” “anticipate,” “expect,” “plan,” “intend,” “estimate,” “target” and similar expressions, are forward-looking statements within the meaning of the Private Securities Litigation Reform Act of 1995. While these forward-looking statements represent our current judgment of what may happen in the future, actual results may differ materially from the results expressed or implied by these statements due to numerous important factors. Our filings with the SEC provide detailed information on such statements and risks and should be consulted along with this release. To the extent permitted under applicable law, IDT assumes no obligation to update any forward-looking statements.
Trade accounts receivable, net of allowance for credit losses of $6,352 at July 31, 2024 and allowance for doubtful accounts of $5,642 at July 31, 2023
42,215
32,092
Settlement assets, net of reserve of $1,866 and $1,143 at July 31, 2024 and 2023, respectively
22,186
32,396
Disbursement prefunding
30,736
30,113
Prepaid expenses
17,558
16,638
Other current assets
25,927
28,394
TOTAL CURRENT ASSETS
422,525
387,068
Property, plant, and equipment, net
38,652
38,655
Goodwill
26,288
26,457
Other intangibles, net
6,285
8,196
Equity investments
6,518
9,874
Operating lease right-of-use assets
3,273
5,540
Deferred income tax assets, net
35,008
24,101
Other assets
11,546
10,919
TOTAL ASSETS
$
550,095
$
510,810
LIABILITIES, REDEEMABLE NONCONTROLLING INTEREST, AND EQUITY
CURRENT LIABILITIES:
Trade accounts payable
$
24,773
$
22,231
Accrued expenses
103,176
110,796
Deferred revenue
30,364
35,343
Customer deposits
83,003
86,481
Settlement liabilities
21,654
21,495
Other current liabilities
16,374
17,761
TOTAL CURRENT LIABILITIES
279,344
294,107
Operating lease liabilities
1,533
2,881
Other liabilities
2,662
3,354
TOTAL LIABILITIES
283,539
300,342
Commitments and contingencies
Redeemable noncontrolling interest
10,901
10,472
EQUITY:
IDT Corporation stockholders’ equity:
Preferred stock, $.01 par value; authorized shares-10,000; no shares issued
–
–
Class A common stock, $.01 par value; authorized shares-35,000; 3,272 shares issued and 1,574 shares outstanding at July 31, 2024 and 2023
33
33
Class B common stock, $.01 par value; authorized shares-200,000; 28,177 and 27,851 shares issued and 23,684 and 23,699 shares outstanding at July 31, 2024 and 2023, respectively
282
279
Additional paid-in capital
303,510
301,408
Treasury stock, at cost, consisting of 1,698 and 1,698 shares of Class A common stock and 4,493 and 4,152 shares of Class B common stock at July 31, 2024 and 2023, respectively
(126,080
)
(115,461
)
Accumulated other comprehensive loss
(18,142
)
(17,192
)
Retained earnings
86,580
24,662
Total IDT Corporation stockholders’ equity
246,183
193,729
Noncontrolling interests
9,472
6,267
TOTAL EQUITY
255,655
199,996
TOTAL LIABILITIES, REDEEMABLE NONCONTROLLING INTEREST, AND EQUITY
$
550,095
$
510,810
IDT CORPORATION CONSOLIDATED STATEMENTS OF INCOME
Year ended July 31 (in thousands, except per share data)
2024 (Unaudited)
2023
2022
REVENUES
$
1,205,778
$
1,238,854
$
1,364,057
DIRECT COST OF REVENUES
815,621
881,614
1,039,059
GROSS PROFIT
390,157
357,240
324,998
OPERATING EXPENSES:
Selling, general and administrative (i)
270,207
243,159
216,922
Technology and development (i)
50,554
47,988
47,045
Severance
1,698
935
116
Other operating expense, net
2,945
4,415
826
TOTAL OPERATING EXPENSES
325,404
296,497
264,909
Income from operations
64,753
60,743
60,089
Interest income, net
4,769
3,147
146
Other expense, net
(7,612
)
(3,083
)
(25,352
)
Income before income taxes
61,910
60,807
34,883
Benefit from (provision for) income taxes
6,354
(16,441
)
(5,878
)
NET INCOME
68,264
44,366
29,005
Net income attributable to noncontrolling interests
(3,810
)
(3,874
)
(1,977
)
NET INCOME ATTRIBUTABLE TO IDT CORPORATION
$
64,454
$
40,492
$
27,028
Earnings per share attributable to IDT Corporation common stockholders:
Basic
$
2.55
$
1.59
$
1.05
Diluted
$
2.54
$
1.58
$
1.03
Weighted-average number of shares used in calculation of earnings per share:
Basic
25,241
25,517
25,791
Diluted
25,398
25,577
26,356
(i) Stock-based compensation included in:
Selling, general and administrative expense
$
7,015
$
3,913
$
1,871
Technology and development expense
$
382
$
605
$
59
IDT CORPORATION CONSOLIDATED STATEMENTS OF CASH FLOWS
Year ended July 31 (in thousands)
2024 (Unaudited)
2023
2022
OPERATING ACTIVITIES
Net income
$
68,264
$
44,366
$
29,005
Adjustments to reconcile net income to net cash provided by operating activities:
Depreciation and amortization
20,351
20,136
18,115
Deferred income taxes
(10,907
)
12,601
4,801
Provision for credit losses, doubtful accounts receivable, and reserve for settlement assets
4,390
2,198
2,330
Net unrealized loss from marketable securities
1,435
3,368
18,960
Stock-based compensation
7,397
4,518
1,930
Other
3,144
3,175
3,379
Changes in assets and liabilities:
Trade accounts receivable
(12,701
)
4,726
(8,279
)
Settlement assets, disbursement prefunding, prepaid expenses, other current assets, and other assets
12,735
(17,503
)
(21,046
)
Trade accounts payable, accrued expenses, settlement liabilities, other current liabilities, and other liabilities
(7,459
)
(17,216
)
(1,110
)
Customer deposits at IDT Financial Services Limited (Gibraltar-based bank)
(3,442
)
(4,200
)
(15,966
)
Deferred revenue
(5,016
)
(2,029
)
(2,712
)
Net cash provided by operating activities
78,191
54,140
29,407
INVESTING ACTIVITIES
Capital expenditures
(18,922
)
(21,958
)
(21,879
)
Payments for acquisitions, net of cash acquired
–
–
(7,552
)
Purchase of convertible preferred stock in equity method investment
(2,017
)
(840
)
(1,051
)
Purchases of debt securities and equity investments
(29,921
)
(59,872
)
(24,454
)
Proceeds from maturities and sales of debt securities and redemption of equity investments
50,112
49,211
21,157
Net cash used in investing activities
(748
)
(33,459
)
(33,779
)
FINANCING ACTIVITIES
Dividends paid
(2,536
)
–
–
Distributions to noncontrolling interests
(112
)
(348
)
(514
)
Proceeds from notes payable
–
300
2,301
Repayment of notes payable
–
(2,037
)
(1,319
)
Proceeds from sale of redeemable equity in subsidiary
–
–
10,000
Proceeds from borrowings under revolving credit facility
32,864
27,383
2,566
Repayments of borrowings under revolving credit facility
(32,864
)
(27,383
)
(2,566
)
Purchase of restricted shares of net2phone and National Retail Solutions common stock
(4,131
)
–
–
Proceeds from exercise of stock options
172
172
137
Repurchases of Class B common stock
(10,619
)
(13,896
)
(26,222
)
Net cash used in financing activities
(17,226
)
(15,809
)
(15,617
)
Effect of exchange rate changes on cash, cash equivalents, and restricted cash and cash equivalents
(3,584
)
4,389
(17,365
)
Net increase (decrease) in cash, cash equivalents, and restricted cash and cash equivalents
56,633
9,261
(37,354
)
Cash, cash equivalents, and restricted cash and cash equivalents at beginning of year
198,823
189,562
226,916
Cash, cash equivalents, and restricted cash and cash equivalents at end of year
$
255,456
$
198,823
$
189,562
SUPPLEMENTAL DISCLOSURE OF CASH FLOW INFORMATION
Cash payments made for interest
$
429
$
536
$
461
Cash payments made for income taxes
$
527
$
777
$
109
SUPPLEMENTAL SCHEDULE OF NON-CASH INVESTING AND FINANCING ACTIVITIES
Value of the Company’s Class B common stock exchanged for National Retail Solutions shares
$
6,696
$
–
$
–
Conversion of equity method investment’s secured promissory notes into convertible preferred stock
$
–
$
4,038
$
–
Shares of the Company’s Class B common stock issued to certain executive officers for bonus payments
$
1,494
$
615
$
–
Liabilities incurred for acquisitions
$
–
$
–
$
7,849
Shares of the Company’s Class B common stock issued for business acquisitions
$
100
$
100
$
1,000
Cashless exercise of stock options in exchange for shares of the Company’s Class B common stock
$
–
$
–
$
14,930
*Explanation of Key Performance Metrics
NRS’ recurring revenue is calculated by subtracting NRS’ revenue from POS terminal sales from its revenue in accordance with generally accepted accounting principles in the United States of America (GAAP). NRS’ Monthly Average Recurring Revenue per Terminal is calculated by dividing NRS’ recurring revenue by the average number of active POS terminals during the period. The average number of active POS terminals is calculated by adding the beginning and ending number of active POS terminals during the period and dividing by two. NRS’ recurring revenue divided by the average number of active POS terminals is divided by three when the period is a fiscal quarter. Recurring revenue and Monthly Average Recurring Revenue per Terminal are useful for comparisons of NRS’ revenue and revenue per customer to prior periods and to competitors and others in the market, as well as for forecasting future revenue from the customer base.
BOSS Money’s Average Revenue per Transaction is calculated by dividing BOSS Money’s revenue in accordance with GAAP by the number of transactions during the period. Average Revenue per Transaction is useful for comparisons of BOSS Money’s revenue per transaction to prior periods and to competitors and others in the market, as well as for forecasting future revenue based on transaction trends.
net2phone’s subscription revenue is calculated by subtracting net2phone’s equipment revenue and revenue generated by a legacy SIP trunking offering in Brazil from its revenue in accordance with GAAP. net2phone’s cloud communications and contact center offerings are priced on a per-seat basis, with customers paying based on the number of users in their organization. The number of seats served and subscription revenue trends and comparisons between periods are used in the analysis of net2phone’s revenues and direct cost of revenues and are strong indications of the top-line growth and performance of the business.
net2phone’s subscription revenue per seat is calculated by dividing net2phone’s subscription revenue, as defined in the preceding paragraph, by the average number of seats served during the period. The average number of seats served is calculated by adding the beginning and ending number of seats served and dividing by two. Subscription revenue per seat is the amount of revenue generated by each seat sold during the period. It provides a basis for pricing seat-based services, as well as for comparing performance in past periods and projecting future revenue, and for comparing the value of each seat served to competitors.
net2phone’s operating margin is calculated by dividing GAAP income from operations by GAAP revenue for the period indicated. Operating margin measures the percentage that each dollar of revenue contributes to profitability. Operating margin is useful for evaluating current period profitability relative to sales, for comparisons to prior period performance, for forecasting future income from operations levels based on projected levels of sales, and for comparing net2phone’s relative profitability to its competitors and peers.
net2phone’s Adjusted EBITDA margin is calculated by dividing net2phone’s Adjusted EBITDA, a Non-GAAP measure, by net2phone’s GAAP revenue for the comparable quarter or period. Adjusted EBITDA margin measures the percentage that each dollar of revenue contributes to profitability before interest, taxes, depreciation and amortization, and other adjustments as described below in the Reconciliation of Non-GAAP Financial Measures. net2phone’s Adjusted EBITDA margin is useful for evaluating current period profitability relative to sales, for comparisons to prior period performance, for forecasting future Adjusted EBITDA levels based on projected levels of sales, and for comparing net2phone’s relative profitability to its competitors and peers.
**Reconciliation of Non-GAAP Financial Measures for the Fourth Quarter and Full Fiscal Years 2024 and 2023
In addition to disclosing financial results that are determined in accordance with GAAP, IDT also disclosed for 4Q24, 3Q24, 4Q23, and the full fiscal years 2024 and 2023, Adjusted EBITDA and non-GAAP earnings per diluted share (EPS). Adjusted EBITDA and Non-GAAP EPS are Non-GAAP financial measures intended to provide useful information that supplements IDT’s or the relevant segment’s results in accordance with GAAP. The following explains these terms and their respective reconciliations to the most directly comparable GAAP measures
Generally, a non-GAAP measure is a numerical measure of a company’s performance, financial position, or cash flows that either excludes or includes amounts that are not normally excluded or included in the most directly comparable measure calculated and presented in accordance with GAAP.
IDT’s measure of non-GAAP EPS is calculated by dividing non-GAAP net income by the diluted weighted-average shares. IDT’s measure of non-GAAP net income starts with net income attributable to IDT in accordance with GAAP and adds severance expense, stock-based compensation, and other operating expenses, and deducts other operating gains. These additions and subtractions are non-cash and/or non-routine items in the relevant fiscal 2024 and fiscal 2023 periods.
Management believes that IDT’s Adjusted EBITDA and non-GAAP EPS are measures which provide useful information to both management and investors by excluding certain expenses and non-routine gains and losses that may not be indicative of IDT’s or the relevant segment’s core operating results. Management uses Adjusted EBITDA, among other measures, as a relevant indicator of core operational strengths in its financial and operational decision making. In addition, management uses Adjusted EBITDA and non-GAAP EPS to evaluate operating performance in relation to IDT’s competitors. Disclosure of these financial measures may be useful to investors in evaluating performance and allows for greater transparency to the underlying supplemental information used by management in its financial and operational decision-making. In addition, IDT has historically reported similar financial measures and believes such measures are commonly used by readers of financial information in assessing performance, therefore the inclusion of comparative numbers provides consistency in financial reporting.
Management refers to Adjusted EBITDA, as well as the GAAP measures income (loss) from operations and net income, on a segment and/or consolidated level to facilitate internal and external comparisons to the segments’ and IDT’s historical operating results, in making operating decisions, for budget and planning purposes, and to form the basis upon which management is compensated.
While depreciation and amortization are considered operating costs under GAAP, these expenses primarily represent the non-cash current period allocation of costs associated with long-lived assets acquired or capitalized in prior periods. IDT’s Adjusted EBITDA, which is exclusive of depreciation and amortization, is a useful indicator of its current performance.
Severance expense is excluded from the calculation of Adjusted EBITDA and non-GAAP EPS. Severance expense is reflective of decisions made by management in each period regarding the aspects of IDT’s and its segments’ businesses to be focused on in light of changing market realities and other factors. While there may be similar charges in other periods, the nature and magnitude of these charges can fluctuate markedly and do not reflect the performance of IDT’s core and continuing operations.
Other operating (expense) gain, net, which is a component of income (loss) from operations, is excluded from the calculation of Adjusted EBITDA and non-GAAP EPS. Other operating (expense) gain, net includes, among other items, legal fees net of insurance claims related to Straight Path Communications Inc.’s stockholders’ class action, gains from the write-off of contingent consideration liabilities, and expense for the indemnification of a cable telephony customer related to a legal settlement. From time-to-time, IDT may have gains or incur costs related to non-routine legal, tax, and other matters, however, these various items generally do not occur each quarter. IDT believes the gain and losses from these non-routine matters are not components of IDT’s or the relevant segment’s core operating results.
Stock-based compensation recognized by IDT and other companies may not be comparable because of the variety of types of awards as well as the various valuation methodologies and subjective assumptions that are permitted under GAAP. Stock-based compensation is excluded from IDT’s calculation of non-GAAP EPS because management believes this allows investors to make more meaningful comparisons of the operating results per share of IDT’s core business with the results of other companies. However, stock-based compensation will continue to be a significant expense for IDT for the foreseeable future and an important part of employees’ compensation that impacts their performance.
In 4Q24, because of the completion of an Internal Revenue Code Section 382 study related to net2phone, IDT recorded an income tax benefit of $23.6 million. This income tax benefit was excluded from IDT’s non-GAAP EPS because it is not related to the results of IDT’s core operations.
Adjusted EBITDA and non-GAAP EPS should be considered in addition to, not as a substitute for, or superior to, income (loss) from operations, cash flow from operating activities, net income, basic and diluted earnings per share or other measures of liquidity and financial performance prepared in accordance with GAAP. In addition, IDT’s measurements of Adjusted EBITDA and non-GAAP EPS may not be comparable to similarly titled measures reported by other companies.
Following are reconciliations of Adjusted EBITDA and non-GAAP EPS to the most directly comparable GAAP measure, which are, (a) for Adjusted EBITDA, income (loss) from operations for IDT’s reportable segments and net income for IDT on a consolidated basis, and (b) for non-GAAP EPS, diluted earnings per share.
IDT Corporation Reconciliation of Net Income to Adjusted EBITDA (unaudited) in millions. Figures may not foot or cross-foot due to rounding to millions
Total IDT Corporation
Traditional Communica-tions
net2phone
NRS
Fintech
Corporate
Three Months Ended July 31, 2024 (4Q24)
Net income attributable to IDT Corporation
$
36.8
Adjustments:
Net income attributable to noncontrolling interests
0.9
Net income
37.7
Benefit from income taxes
(17.3
)
Income before income taxes
20.4
Interest income, net
(1.6
)
Other expense, net
1.3
Income (loss) from operations
20.1
$
13.9
$
0.8
$
6.0
$
2.5
$
(3.2
)
Depreciation and amortization
5.1
1.9
1.6
0.9
0.7
–
Severance
–
0.3
–
–
–
(0.3
)
Other operating (gains) expense, net
(0.1
)
0.2
–
0.2
(1.8
)
1.3
Adjusted EBITDA
$
25.2
$
16.3
$
2.5
$
7.1
$
1.5
$
(2.2
)
Total IDT Corporation
Traditional Communica-tions
net2phone
NRS
Fintech
Corporate
Three Months Ended April 30, 2024 (3Q24)
Net income attributable to IDT Corporation
$
5.6
Adjustments:
Net income attributable to noncontrolling interests
0.8
Net income
6.3
Provision for income taxes
3.0
Income before income taxes
9.3
Interest income, net
(1.2
)
Other expense, net
3.3
Income (loss) from operations
11.4
$
12.5
$
0.5
$
4.8
$
(0.6
)
$
(5.7
)
Depreciation and amortization
5.1
2.0
1.6
0.8
0.7
–
Severance
0.8
0.4
0.1
–
–
0.3
Other operating expense, net
3.2
–
–
–
0.1
3.2
Adjusted EBITDA
$
20.6
$
14.9
$
2.1
$
5.6
$
0.2
$
(2.3
)
IDT Corporation Reconciliation of Net Income to Adjusted EBITDA (unaudited) in millions. Figures may not foot or cross-foot due to rounding to millions
Total IDT Corporation
Traditional Communica-tions
net2phone
NRS
Fintech
Corporate
Three Months Ended July 31, 2023 (4Q23)
Net income attributable to IDT Corporation
$
8.0
Adjustments:
Net income attributable to noncontrolling interests
0.8
Net income
8.8
Provision for income taxes
3.8
Income before income taxes
12.6
Interest income, net
(1.1
)
Other expense, net
0.5
Income (loss) from operations
12.0
$
14.1
$
(0.7
)
$
1.7
$
(1.9
)
$
(1.2
)
Depreciation and amortization
5.1
2.3
1.5
0.7
0.7
–
Severance
0.5
0.4
0.1
–
–
–
Other operating expense, net
0.5
1.8
0.1
–
–
(1.4
)
Adjusted EBITDA
$
18.1
$
18.6
$
0.9
$
2.4
$
(1.2
)
$
(2.6
)
IDT Corporation Reconciliation of Net Income to Adjusted EBITDA (unaudited) in millions. Figures may not foot or cross-foot due to rounding to millions
Total IDT Corporation
Traditional Communica-tions
net2phone
NRS
Fintech
Corporate
Year Ended July 31, 2024 (FY 2024)
Net income attributable to IDT Corporation
$
64.5
Adjustments:
Net income attributable to noncontrolling interests
3.8
Net income
68.3
Benefit from income taxes
(6.4
)
Income before income taxes
61.9
Interest income, net
(4.8
)
Other expense, net
7.6
Income (loss) from operations
64.8
$
56.4
$
1.7
$
21.6
$
(0.1
)
$
(14.9
)
Depreciation and amortization
20.4
8.1
6.1
3.2
2.9
0.1
Severance
1.7
1.6
0.1
–
–
–
Other operating expense (gains), net
2.9
0.2
(0.1
)
0.2
(1.8
)
4.4
Adjusted EBITDA
$
89.7
$
66.3
$
7.9
$
25.0
$
1.1
$
(10.4
)
Total IDT Corporation
Traditional Communica-tions
net2phone
NRS
Fintech
Corporate
Year Ended July 31, 2023 (FY 2023)
Net income attributable to IDT Corporation
$
40.5
Adjustments:
Net income attributable to noncontrolling interests
3.9
Net income
44.4
Provision for income taxes
16.4
Income before income taxes
60.8
Interest income, net
(3.1
)
Other expense, net
3.1
Income (loss) from operations
60.7
$
61.3
$
(2.8
)
$
14.4
$
(2.5
)
$
(9.7
)
Depreciation and amortization
20.1
9.4
5.6
2.4
2.7
0.1
Severance
0.9
0.9
0.1
–
–
–
Other operating expense (gain), net
4.4
5.9
0.1
–
(1.9
)
0.3
Adjusted EBITDA
$
86.2
$
77.5
$
3.0
$
16.8
$
(1.8
)
$
(9.3
)
IDT Corporation Reconciliation of Earnings per shareto Non-GAAP EPS (unaudited) in millions, except per share data. Figures may not foot due to rounding to millions.
4Q24
3Q24
4Q23
FY 2024
FY 2023
Net income attributable to IDT Corporation
$
36.8
$
5.6
$
8.0
$
64.5
$
40.5
Adjustments (add) subtract:
Income tax benefit
23.6
–
–
23.6
–
Stock-based compensation
(2.0
)
(2.1
)
(1.0
)
(7.4
)
(4.5
)
Severance expense
(0.1
)
(0.8
)
(0.5
)
(1.7
)
(0.9
)
Other operating gain (expense), net
0.1
(3.2
)
(0.5
)
(2.9
)
(4.4
)
Total adjustments
21.6
(6.1
)
(2.0
)
11.6
(9.8
)
Income tax effect of total adjustments
(0.6
)
(2.0
)
(0.7
)
(3.4
)
(2.6
)
(22.2
)
4.1
1.3
(15.0
)
7.2
Non-GAAP net income
$
14.6
$
9.7
$
9.3
$
49.5
$
47.7
Earnings per share:
Basic
$
1.46
$
0.22
$
0.31
$
2.55
$
1.59
Total adjustments
(0.88
)
0.16
0.06
(0.59
)
0.28
Non-GAAP – basic
$
0.58
$
0.38
$
0.37
$
1.96
$
1.87
Weighted-average number of shares used in calculation of basic earnings per share
25.3
25.3
25.4
25.2
25.5
Diluted
$
1.45
$
0.22
$
0.31
$
2.54
$
1.58
Total adjustments
(0.88
)
0.16
0.05
(0.59
)
0.28
Non-GAAP – diluted
$
0.57
$
0.38
$
0.36
$
1.95
$
1.86
Weighted-average number of shares used in calculation of diluted earnings per share
25.4
25.5
25.5
25.4
25.6
# # #
IDT Corporation to Report Fourth Quarter and Fiscal Year 2024 Results
NEWARK, NJ, Sept. 23, 2024 — IDT Corporation (NYSE: IDT), a global provider of fintech, cloud communications, and traditional communications solutions, has scheduled its report of financial and operational results for the fourth quarter and fiscal year 2024 (the three and twelve months ended July 31, 2024) on Tuesday, October 8, 2024.
IDT’s earnings release will be issued and posted on the IDT investor relations website (https://www.idt.net/investors-and–media) at approximately 4:30 PM Eastern.
IDT will host an earnings conference call beginning at 5:30 PM Eastern with management’s discussion of results followed by Q&A with investors. To listen to the call and participate in the Q&A, dial 1-888-506-0062 (toll-free from the US) or 1-973-528-0011 (international) and provide the following access code: 126998).
A replay of the conference call will be available approximately three hours after the call concludes through October 22, 2024. To access the call replay, dial 1-877-481-4010 (toll-free from the US) or 1-919-882-2331 (international) and provide this replay passcode: 51021. The replay will also be accessible via streaming audio at the IDT investor relations website.
ABOUT IDT CORPORATION
IDT Corporation (NYSE: IDT) is a global provider of fintech and communications solutions through a portfolio of synergistic businesses: National Retail Solutions (NRS), through its point-of-sale (POS) platform, enables independent retailers to operate more effectively while providing advertisers and marketers with unprecedented reach into underserved consumer markets; BOSS Money facilitates innovative international remittances and fintech payments solutions; net2phone provides enterprises and organizations with intelligently integrated cloud communications and contact center services across channels and devices; IDT Digital Payments and BOSS Revolution Calling make sharing prepaid products and services and speaking with friends and family around the world convenient and reliable; and, IDT Global and IDT Express enable communications services to provision and manage international voice and SMS messaging.
NRSInsights’ August 2024 Retail Same-Store Sales Report
August same-store sales increased 5.1% year-over-year
NEWARK, N.J., Sept. 09, 2024 — NRSInsights, a provider of sales data and analytics drawn from retail transactions processed through the National Retail Solutions (NRS) point-of-sale (POS) platform, today announced comparative same-store sales results for August 2024.
As of August 31, 2024, the NRS retail network comprised approximately 32,300 active terminals nationwide, scanning purchases at independent retailers including bodegas, convenience stores, liquor stores, grocers, tobacco, and sundries sellers nationwide, predominantly serving urban consumers.
August Retail Same-Store Sales Highlights
(Same-store sales, unit sales, transactions, and average price data throughout this release refer to August 2024 and are compared to August 2023 unless otherwise noted. All comparisons are provided on a “per calendar day” basis to remove from consideration variability in the number of days per month.)
SALES
Same-store sales increased 5.1% year-over-year. In the previous month (July 2024), same-store sales had increased 1.2% year-over-year.
Same-store sales increased 1.7% compared to the previous month (July 2024). Same-store sales in July 2024 had decreased (1.9)% compared to the previous month (June 2024).
For the three months ended August 31, 2024, same-store sales increased 3.2% compared to the same three months a year ago.
UNITS SOLD
The number of units sold increased 4.7% year-over-year. In the previous month (July 2024), the number of items sold had increased 2.2% year-over-year.
Units sold increased 1.3% compared to the previous month (July 2024). Units sold in July 2024 had decreased (1.7)% compared to the previous month (June 2024).
TRANSACTIONS PER STORE
The average number of transactions per store increased 1.8% year-over-year. In the previous month (July 2024), transactions decreased (0.6)% year-over-year.
Transactions increased 1.5% compared to the previous month (July 2024). Transactions in July 2024 had decreased (1.9)% compared to the previous month (June 2024).
AVERAGE PRICES
A dollar-weighted average of prices for the top 500 items purchased during August 2024 increased 3.5% year-over-year, an increase from the 2.5% year-over-year increase recorded in July 2024.
Retail Trade Comparative Data
The table below provides historical comparative data with the U.S. Commerce Department’s Advance Monthly Retail Trade same-store sales data excluding food service:
Over the past twelve months, the NRS network’s three-month moving average same-store sales have outpaced the US Commerce Department’s Advance Monthly Retail Trade data, excluding food services, by 3.0% percentage points, on average.
The NRSInsights data in the chart above have not been adjusted to reflect inflation, demographic distributions, seasonal buying patterns, item substitution, days per month, or other factors that may facilitate comparisons to other periods, to other same-store retail sales data, or to the U.S. Commerce Department’s retail data.
Commentary from Suzy Silliman (SVP, Data Strategy and Sales at NRS)
“NRS’ year over year rate of same-store sales growth jumped to 5.1% in August after a weak July.
“August is back-to-school month for many universities and K-12 districts. We saw not only the expected sales growth versus July but also a robust increase versus August 2023, most notably in school-related categories including Office Supply, Writing Tools, and Computer/Printer accessories.
“Cookie Snacks and Variety Packs, convenient options for school lunches, also realized strong year-over-year growth, as did sales of Baking Staples, Extracts/Herbs/Spices/Seasoning, Baking Mixes and Baking Supplies.
“On the other hand, sales of the Candy/Gum/Mints and Sweet Snacks categories continued to decline year-over-year.
“While our measure of inflationary pressure increased in August for the second consecutive month, rising to 3.5%, that increase was largely driven by a spike in the prices of tobacco products. Absent that, the underlying rate of year-over-year increase was 2.5%, the same as July.”
NRSInsights Reports
The NRSInsights monthly Same-Store Retail Sales Reports are intended to provide timely topline data reflective of sales at NRS’ network of independent, predominantly urban, retail stores.
Same-store data comparisons of August 2024 with August 2023 are derived from approximately 196 million transactions processed through the approximately 19,100 stores on the NRS network that scanned transactions in both months. Same-store data comparisons of August 2024 with July 2024 are derived from approximately 253 million transactions processed through approximately 27,000 stores.
Same-store data comparisons for the three months ended August 31, 2024 with the year-ago three months are derived from approximately 557 million scanned transactions processed through those stores that were in the NRS network in both quarters.
NRS POS Network
The NRS network comprises approximately 32,300 active POS terminals operating in approximately 28,100 independent retail stores. Its platform predominantly serves small-format, independent, retail stores including convenience stores, bodegas, liquor stores, grocers, tobacco, and sundries sellers. The network includes retailers in all 50 states as well as the District of Columbia, and in 200 of the 210 designated market areas (DMAs) in the United States. NRS’ POS terminals processed $19.8 billion in sales through approximately 1.4 billion transactions during the twelve months ended August 31, 2024.
About National Retail Solutions (NRS):
National Retail Solutions operates the largest point-of-sale (POS) terminal-based platform and digital payment processing service for independent retailers nationwide. Retailers utilize NRS offerings to process transactions and effectively manage their businesses. Consumer packaged goods (CPG) suppliers, brokers, analytics firms, and advertisers access the terminal’s digital display network to reach these retailers’ predominantly urban, multi-cultural shopper base, and to harness transaction data-based learnings to identify growth opportunities and measure execution and returns on marketing investment. NRS is a subsidiary of IDT Corporation (NYSE: IDT).
All statements above that are not purely about historical facts, including, but not limited to, those in which we use the words “believe,” “anticipate,” “expect,” “plan,” “intend,” “estimate,” “target” and similar expressions, are forward-looking statements within the meaning of the Private Securities Litigation Reform Act of 1995. While these forward-looking statements represent our current judgment of what may happen in the future, actual results may differ materially from the results expressed or implied by these statements due to numerous important factors. Our filings with the SEC provide detailed information on such statements and risks, and should be consulted along with this release. To the extent permitted under applicable law, IDT assumes no obligation to update any forward-looking statements.
NRSInsights Contact: Suzy Silliman SVP, Data Strategy and Sales at NRS National Retail Solutions suzy.silliman@nrsplus.com
net2phone Introduces a Single-Pane-of-Glass View for Engaging Business Conversations Across Channels
Powerful New Interface Allows net2phone Unite Users to Manage All Communications from One Screen, Making It Easy to Engage Whether in The Office, Working Remotely or On-the-Go
Other New Features Include AI-Powered Call Summaries & Transcriptions, and Internal Team Chats
Newark, NJ, Aug. 27, 2024 — net2phone, a leading provider of intelligent communications-as-a-service for businesses and contact centers, today unveiled a bold new interface for its Unite business communications platform while adding AI-powered instant call summaries and transcriptions, and internal team chat.
The Unite single-pane-of-glass view enables business users to manage and engage with multiple conversations across voice, video meetings, and messaging.
“Our flagship business communications platform now ‘unites’ diverse conversational threads together in a single, beautifully arranged view. Our users can track, manage, initiate, or join conversations — moving fluidly across phone calls, virtual meetings, text messages, and internal chat,” said Jonah Fink, President of net2phone. “We are also introducing instant AI-generated call summaries and transcriptions to enhance workflows and collaboration.”
These powerful new tools harmonize with the key features that net2phone’s clients have long relied upon to power their conversations across channels and devices:
Unlimited domestic calling;
Unlimited international calling to 40+ countries;
Call recording;
Video conferencing;
Web and mobile apps to enable untethered communications from laptop or smartphone;
SMS/MMS text messaging.
Daniel Leubitz, Head of Product at net2phone, added, “We are proud to release Unite’s enhanced user interface. The interface not only enables businesses to communicate more effectively by converging diverse channels into a single, intuitive screen, but also leverages AI for smarter, more effective interactions and engagement.”
See Unite in action here: https://youtu.be/mI2a0QzHKnc, or to learn more about how Unite can enhance your business, visit net2phone.com and get connected with a net2phone expert.
About net2phone:
net2phone’s innovative cloud-based, unified communications as a service, contact center as a service and SIP trunking solutions help businesses around the globe succeed through smarter conversations with enhanced intelligence and insights. net2phone’s commitment to delivering reliable and high-quality communications services has earned it a reputation as a leader in both innovation and growth. net2phone is a subsidiary of IDT Corporation (NYSE: IDT). To learn more, please visit net2phone.com or connect on LinkedIn.
NRSInsights’ July 2024 Retail Same-Store Sales Report
July same-store sales increased 1.2% year-over-year
NEWARK, N.J., Aug. 08, 2024 — NRSInsights, a provider of sales data and analytics drawn from retail transactions processed through the National Retail Solutions (NRS) point-of-sale (POS) platform, today announced comparative same-store sales results for July 2024.
As of July 31, 2024, the NRS retail network comprised approximately 32,100 active terminals nationwide, scanning purchases at independent retailers including bodegas, convenience stores, liquor stores, grocers, tobacco, and sundries sellers nationwide, predominantly serving urban consumers.
July Retail Same-Store Sales Highlights
(Same-store sales, unit sales, transactions, and average price data throughout this release refer to July 2024 unless otherwise noted. All comparisons are provided on a “per calendar day” basis to remove from consideration variability in the number of days per month.)
Same-store sales increased 1.2% from a year earlier (July 2023). In the previous month (June 2024), same-store sales had increased 5.1% compared to June 2023.
Same-store sales decreased 1.9% compared to the previous month (June 2024). Same-store sales in June 2024 had increased 1.6% compared to the previous month (May 2024).
For the three months ended July 31 2024, same-store sales increased 3.0% compared to the three months ended July 31, 2023.
The number of units sold increased 2.2% from a year earlier (July 2023). In the previous month (June 2024), the number of items sold had increased 5.5% compared to June 2023.
The average number of transactions per store decreased 0.6% from a year earlier (July 2023). In the previous month (June 2024), the average number of transactions had increased 2.8% compared to June 2023.
A dollar-weighted average of prices for the top 500 items purchased during July 2024 increased 2.5% year-over-year, an increase from the 1.1% year-over-year increase recorded in June 2024.
Retail Trade Comparative Data
The table below provides historical comparative data with the U.S. Commerce Department’s Advance Monthly Retail Trade same-store sales data excluding food service:
Over the past twelve months, the NRS network’s three-month moving average same-store sales have outpaced the US Commerce Department’s Advance Monthly Retail Trade data, excluding food services, by 2.3% percentage points, on average.
The NRSInsights data in the chart above have not been adjusted to reflect inflation, demographic distributions, seasonal buying patterns, item substitution, days per month, or other factors that may facilitate comparisons to other periods, to other same-store retail sales data, or to the U.S. Commerce Department’s retail data.
Commentary from Suzy Silliman (SVP, Data Strategy and Sales at NRS)
“The rate of same-store sales growth moderated across the NRS network in July, continuing a year-long trend. The year-over-year rate of nominal increase has decreased from over 6% for the three months ended July 2023 to 3% for the same period this year. Inflation, meanwhile, as measured by the weighted price per unit of our 500 most frequently sold items, remained relatively subdued at 2.5%, although over the past two months it has increased off the lows earlier in the year.
“July’s nationwide results were modestly impacted by Hurricane Beryl, which triggered double digit sales decreases versus July 2023 in coastal and Southeast Texas markets, including Corpus Christi and Houston. Beryl, which disrupted distribution throughout the impacted regions, also caused widespread, extended-term power outages.
“On par with previous months, we continued to see notable growth in sales of Tequila, Prepared Cocktails, Smokeless Tobacco and Non-Alcoholic Beer during July, while sales of Energy Drinks, Chocolates and Confections, Vape, and sweet snacks such as packaged brownies, doughnuts, cakes, and pies, all declined.
“Although the U.S. continued to swelter under protracted heatwaves during the month, the unusually robust sales levels of Packaged Non-Alcoholic Beverages that we measured in June were not sustained for a second month. In July, Carbonated Soft Drinks, Bottled Water, and Sports Drinks volumes all returned to their respective trendlines.”
NRSInsights Reports
The NRSInsights monthly Same-Store Retail Sales Reports are intended to provide timely topline data reflective of sales at NRS’ network of independent, predominantly urban, retail stores.
Same-store data comparisons of July 2024 with July 2023 are derived from approximately 194 million transactions processed through the approximately 18,700 stores on the NRS network that scanned transactions in both months. Same-store data comparisons of July 2024 with June 2024 are derived from approximately 248 million transactions processed through approximately 26,700 stores.
Same-store data comparisons for the three months ended July 31, 2024 with the year-ago three months are derived from approximately 549 million scanned transactions processed through the stores that were in the NRS network in both quarters.
NRS POS Network
The NRS network comprises approximately 32,100 active POS terminals operating in approximately 27,800 independent retail stores. Its platform predominantly serves small-format, independent, retail stores including convenience stores, bodegas, liquor stores, grocers, tobacco, and sundries sellers. The network includes retailers in all 50 states as well as the District of Columbia, and in 200 of the 210 designated market areas (DMAs) in the United States. NRS’ POS terminals processed $19.4 billion in sales through approximately 1.4 billion transactions during the twelve months ended July 31, 2024.
About National Retail Solutions (NRS):
National Retail Solutions operates the largest point-of-sale (POS) terminal-based platform and digital payment processing service for independent retailers nationwide. Retailers utilize NRS offerings to process transactions and effectively manage their businesses. Consumer packaged goods (CPG) suppliers, brokers, analytics firms, and advertisers access the terminal’s digital display network to reach these retailers’ predominantly urban, multi-cultural shopper base, and to harness transaction data-based learnings to identify growth opportunities and measure execution and returns on marketing investment. NRS is a subsidiary of IDT Corporation (NYSE: IDT).
All statements above that are not purely about historical facts, including, but not limited to, those in which we use the words “believe,” “anticipate,” “expect,” “plan,” “intend,” “estimate,” “target” and similar expressions, are forward-looking statements within the meaning of the Private Securities Litigation Reform Act of 1995. While these forward-looking statements represent our current judgment of what may happen in the future, actual results may differ materially from the results expressed or implied by these statements due to numerous important factors. Our filings with the SEC provide detailed information on such statements and risks, and should be consulted along with this release. To the extent permitted under applicable law, IDT assumes no obligation to update any forward-looking statements.
NRSInsights Contact: Suzy Silliman SVP, Data Strategy and Sales at NRS National Retail Solutions suzy.silliman@nrsplus.com
NRSInsights’ June 2024 Retail Same-Store Sales Report
June same-store sales increased 5.1% year-over-year
NEWARK, N.J., July 08, 2024 — NRSInsights, a provider of sales data and analytics drawn from retail transactions processed through the National Retail Solutions (NRS) point-of-sale (POS) platform, today announced comparative same-store sales results for June 2024.
As of June 30, 2024, the NRS retail network comprised approximately 31,400 active terminals scanning purchases at independent retailers including bodegas, convenience stores, liquor stores, grocers, tobacco, and sundries sellers nationwide, predominantly serving urban consumers.
June Retail Same-Store Sales Highlights
(Same-store sales, unit sales, transactions, and average price data throughout this release refer to June 2024 unless otherwise noted. All comparisons are provided on a “per calendar day” basis to remove from consideration variability in the number of days per month.)
Same-store sales increased 5.1% from a year earlier (June 2023). In the previous month (May 2024), same-store sales had increased 4.7% compared to May 2023.
Same-store sales increased 1.6% compared to the previous month (May 2024). Same-store sales in May 2024 had increased 3.4% compared to the previous month (April 2024).
For the three months ended June 30, 2024, same-store sales increased 3.5% compared to the three months ended June 30, 2023.
The number of units sold increased 5.5% from a year earlier (June 2023). In the previous month (May 2024), the number of items sold had increased 4.7% compared to May 2023.
The average number of transactions per store increased 2.8% from a year earlier (June 2023). In the previous month (May 2024), the average number of transactions had increased 2.3% compared to May 2023.
A dollar-weighted average of prices for the top 500 items purchased increased 1.1% year-over-year, a decrease from the 1.6% year-over-year increase recorded in May 2024.
Retail Trade Comparative Data
The table below provides historical comparative data with the U.S. Commerce Department’s Advance Monthly Retail Trade same-store sales data excluding food service:
The NRSInsights data in the chart above have not been adjusted to reflect inflation, demographic distributions, seasonal buying patterns, item substitution, days per month, or other factors that may facilitate comparisons to other periods, to other same-store retail sales data, or to the U.S. Commerce Department’s retail data.
Commentary from Suzy Silliman (SVP, Data Strategy and Sales at NRS)
“June 2024 again produced strong results across the NRS network versus June of 2023 in all three same-store sales metrics: dollars, units sold, and transactions (baskets).
“Growth was spread across geographic regions, with thirty-seven of the fifty U.S. states increasing all three metrics and all but eight states enjoying transaction growth. States in the Northeast were responsible for over 50% of the network transaction growth versus June 2023 while stores in Florida and Texas, in aggregate, underperformed.
“With much of the U.S. under a heat advisory during at least part of June this year, seasonal categories outperformed. Sun Care led with dollars, units sold, and baskets all tracking over 50% ahead of June 2023’s levels. Ice, Condiments, Pest Control and Deodorant also trended higher. In terms of its impact on sales dollar growth for the NRS network in aggregate, Packaged Beverages, including both alcoholic and non-alcoholic categories, was the key driver.
“Sales for both the Candy/Gum/Mints and the Tobacco Alternatives/Vape categories underperformed in June versus a year ago, continuing a recent trend. Sweet Snacks – which includes packaged cakes, cupcakes and pies, muffins, dessert bars, doughnuts, and similar items – also had a softer June this year for all three sales metrics. In recent months, Sweet Snacks had benefitted from shoppers who had switched from Candy to satisfy their sweet tooth, so we are keeping an eye on this month’s break in that trend.”
NRSInsights Reports
The NRSInsights monthly Same-Store Retail Sales Reports are intended to provide timely topline data reflective of sales at NRS’ network of independent, predominantly urban, retail stores.
Same-store data comparisons of June 2024 with June 2023 are derived from approximately 186 million transactions processed through the approximately 18,400 stores on the NRS network that scanned transactions in both months. Same-store data comparisons of June 2024 with May 2024 are derived from approximately 246 million transactions processed through approximately 26,200 stores.
Same-store data comparisons for the three months ended June 30, 2024 with the year-ago three months are derived from approximately 530 million scanned transactions processed through the stores that were in the NRS network in both quarters.
NRS POS Network
The NRS network comprises approximately 31,400 active POS terminals operating in approximately 27,300 independent retail stores. Its platform predominantly serves small-format, independent, retail stores including convenience stores, bodegas, liquor stores, grocers, tobacco, and sundries sellers. The network includes retailers in all 50 states as well as the District of Columbia, and in 200 of the 210 designated market areas (DMAs) in the United States. NRS’ POS terminals processed $19.1 billion in sales through approximately 1.4 billion transactions during the twelve months ended June 30, 2024.
About National Retail Solutions (NRS):
National Retail Solutions operates the largest point-of-sale (POS) terminal-based platform and digital payment processing service for independent retailers nationwide. Retailers utilize NRS offerings to process transactions and effectively manage their businesses. Consumer packaged goods (CPG) suppliers, brokers, analytics firms, and advertisers access the terminal’s digital display network to reach these retailers’ predominantly urban, multi-cultural shopper base, and to harness transaction data-based learnings to identify growth opportunities and measure execution and returns on marketing investment. NRS is a subsidiary of IDT Corporation (NYSE: IDT).
All statements above that are not purely about historical facts, including, but not limited to, those in which we use the words “believe,” “anticipate,” “expect,” “plan,” “intend,” “estimate,” “target” and similar expressions, are forward-looking statements within the meaning of the Private Securities Litigation Reform Act of 1995. While these forward-looking statements represent our current judgment of what may happen in the future, actual results may differ materially from the results expressed or implied by these statements due to numerous important factors. Our filings with the SEC provide detailed information on such statements and risks, and should be consulted along with this release. To the extent permitted under applicable law, IDT assumes no obligation to update any forward-looking statements.
NRSInsights Contact: Suzy Silliman SVP, Data Strategy and Sales at NRS National Retail Solutions suzy.silliman@nrsplus.com
NRSInsights’ May 2024 Retail Same-Store Sales Report
May same-store sales increased 4.7% year-over-year
NEWARK, N.J., June 07, 2024 — NRSInsights, a provider of sales data and analytics drawn from retail transactions processed through the National Retail Solutions (NRS) point-of-sale (POS) platform, today announced comparative same-store sales results for May 2024.
As of May 31, 2024, the NRS retail network comprised approximately 30,800 active terminals scanning purchases at independent retailers including bodegas, convenience stores, liquor stores, grocers, tobacco, and sundries sellers nationwide, predominantly serving urban consumers.
May Retail Same-Store Sales Highlights
(Same-store sales, unit sales, transactions, and average price data throughout this release refer to May 2024 unless otherwise noted. All comparisons are provided on a “per calendar day” basis to remove from consideration variability in the number of days per month.)
Same-store sales increased 4.7% from a year earlier (May 2023). In the previous month (April 2024), average sales had increased 2.5% compared to April 2023.
Same-store sales increased 3.4% compared to the previous month (April 2024). Same-store sales in April 2024 had decreased 0.9% compared to the previous month (March 2024).
For the three months ended May 31, 2024, same-store sales increased 4.3% compared to the three months ended May 31, 2023.
The number of items sold increased 4.7% from a year earlier (May 2023). In the previous month (April 2024), the number of items sold had increased 3.7% compared to April 2023.
The average number of transactions per store increased 2.3% from a year earlier (May 2023). In the previous month (April 2024), the average number of transactions had increased 1.7% compared to April 2023.
A dollar-weighted average of prices for the top 500 items purchased increased 1.6% year-over-year, an increase from the 0.2% year-over-year increase recorded in April 2024 and the highest rate of price increases reported since November 2023.
Commentary from Suzy Silliman (SVP, Data Strategy and Sales at NRS)
“In May, the NRS point-of-sale network generated solid same-store sales growth versus the year ago and prior month across dollars, baskets, and units scanned.
“Looking at popular categories, Smokeless Tobacco sales continued their upward trajectory propelled by the surging popularity of nicotine pouches, while Tobacco and Cigarette sales declined modestly from year ago levels. Within the Tobacco Alternatives category, Vape scans stood out with continued year-over-year decreases in baskets, units and dollar sales.
“Within Beverages, mid-May marks the start of ‘cold beverage season.’ This May we did indeed see the expected, sequential lift across most cold beverage categories. Beer, NA Beer, FMB/Cider/Seltzer, Soft Drinks, Water (still, value-add, and sparkling), and Coconut Water all grew dollar sales sequentially and year over year. Bucking the trend, Energy Drinks and Sports Drinks saw little seasonal benefit and trailed year-ago sales levels.
“Sales of high-protein offerings, including Performance Nutritional Shakes and Bars, as well as Protein Salty Snacks have increased significantly in recent months. Their market strength closely correlates with broader retail patterns influenced by the increasing popularity of GLP-1 agonist weight loss drugs, which are often paired with high-protein diets for optimal outcomes. Across the retail landscape, health trends, consumer preferences, and product innovation remain key inter-connected drivers of category and brand performance.”
Retail Trade Comparative Data
The table below provides historical comparative data with the U.S. Commerce Department’s Advance Monthly Retail Trade same-store sales data excluding food service:
The NRSInsights data in the chart above have not been adjusted to reflect inflation, demographic distributions, seasonal buying patterns, item substitution, days per month, or other factors that may facilitate comparisons to other periods, to other same-store retail sales data, or to the U.S. Commerce Department’s retail data.
NRSInsights Reports
The NRSInsights monthly Same-Store Retail Sales Reports are intended to provide timely topline data reflective of sales at NRS’ network of independent, predominantly urban, retail stores.
Same-store data comparisons of May 2024 with May 2023 are derived from approximately 187 million transactions processed through the approximately 18,000 stores on the NRS network that scanned transactions in both months. Same-store data comparisons of May 2024 with April 2024 are derived from approximately 238 million transactions processed through approximately 25,700 stores.
Same-store data comparisons for the three months ended May 31, 2024 with the year-ago three months are derived from approximately 516 million scanned transactions processed through the stores that were in the NRS network in both quarters.
NRS POS Network
The NRS network comprises approximately 30,800 active POS terminals operating in approximately 26,800 independent retail stores. Its platform predominantly serves small-format, independent, retail stores including convenience stores, bodegas, liquor stores, grocers, tobacco and sundries sellers. The network includes retailers in all 50 states and in 198 of the 210 designated market areas (DMAs) in the United States. NRS’ POS terminals have processed $18.8 billion in sales through approximately 1.3 billion transactions during the twelve months ended May 31, 2024.
About National Retail Solutions (NRS):
National Retail Solutions operates the largest point-of-sale (POS) terminal-based platform and digital payment processing service for independent retailers nationwide. Retailers utilize NRS offerings to process transactions and effectively manage their businesses. Consumer packaged goods (CPG) suppliers, brokers, analytics firms, and advertisers access the terminal’s digital display network to reach these retailers’ predominantly urban, multi-cultural shopper base, and to harness transaction data-based learnings to identify growth opportunities and measure execution and returns on marketing investment. NRS is a subsidiary of IDT Corporation (NYSE: IDT).
All statements above that are not purely about historical facts, including, but not limited to, those in which we use the words “believe,” “anticipate,” “expect,” “plan,” “intend,” “estimate,” “target” and similar expressions, are forward-looking statements within the meaning of the Private Securities Litigation Reform Act of 1995. While these forward-looking statements represent our current judgment of what may happen in the future, actual results may differ materially from the results expressed or implied by these statements due to numerous important factors. Our filings with the SEC provide detailed information on such statements and risks, and should be consulted along with this release. To the extent permitted under applicable law, IDT assumes no obligation to update any forward-looking statements.
NRSInsights Contact: Suzy Silliman SVP, Data Strategy and Sales at NRS National Retail Solutions suzy.silliman@nrsplus.com